### [详解微信小程序中如何安装和引用ECharts?](https://www.prosaas.cn/article/16370)
**Published:** 2021-10-19T02:55:18
**Author:** 5201314
**Excerpt:** 本篇文章给大家介绍一下微信小程序中使用 npm 引入 ECharts 的方法,希望对大家有所帮助!Apache…
本篇文章给大家介绍一下微信小程序中使用 npm 引入 ECharts 的方法,希望对大家有所帮助!

Apache ECharts 官方提供了在微信小程序中使用Echarts 的代码实例和 `ec-canvas` 组件,但是未发布 `npm` 包。
此项目在官方代码之上修改支持 `ec-canvas` 组件传入 `echarts` 可支持 `npm` 引入 `echarts` 或本地自定义构建后的 `echarts`,更符合 `Web` 开发体验。
并且发布 `npm` 包,支持小程序通过 npm 安装使用。并支持 `Taro` 按需引入 `echarts` 减小打包体积。【相关学习推荐:小程序开发教程】
## 安装
npm install echarts-for-weixin
## 小程序引用
参考代码 `tools/demo`
1、首先在页面的 json 文件加入 usingComponents 配置字段
{
"usingComponents": {
"ec-canvas": "echarts-for-weixin"
}
}
2、项目根目录创建 `package.json` 并执行 npm install 安装依赖
{
"dependencies": {
"echarts": "^5.1.2",
"echarts-for-weixin": "^1.0.0"
}
}
3、小程序开发者工具中构建 npm
点击开发者工具中的菜单栏:工具 --> 构建 npm
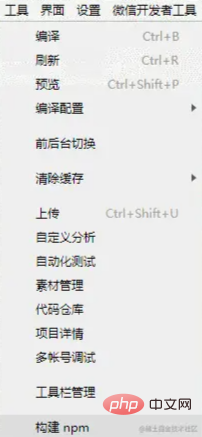
4、在页面中引入 `echarts`,可以从 `npm` 引入 `echarts`,也可以引入本地自定义构建的 `echarts` 以减小体积
import \* as echarts from 'echarts' // 从 npm 引入 echarts
import \* as echarts from './echarts' // 或者从本地引入自定义构建的 echarts
5、然后可以在对应页面的 wxml 中直接使用该组件
6、`ec-canvas` 的具体用法和如何初始化图表请参考 Echarts 官方小程序示例
import \* as echarts from 'echarts'
let chart = null;
function initChart(canvas, width, height, dpr) {
chart = echarts.init(canvas, null, {
width: width,
height: height,
devicePixelRatio: dpr // new
});
canvas.setChart(chart);
var option = {
tooltip: {
trigger: 'axis',
axisPointer: { // 坐标轴指示器,坐标轴触发有效
type: 'shadow' // 默认为直线,可选为:'line' | 'shadow'
},
confine: true
},
legend: {
data: \['热度', '正面', '负面'\]
},
grid: {
left: 20,
right: 20,
bottom: 15,
top: 40,
containLabel: true
},
xAxis: \[
{
type: 'value',
axisLine: {
lineStyle: {
color: '#999'
}
},
axisLabel: {
color: '#666'
}
}
\],
yAxis: \[
{
type: 'category',
axisTick: { show: false },
data: \['汽车之家', '今日头条', '百度贴吧', '一点资讯', '微信', '微博', '知乎'\],
axisLine: {
lineStyle: {
color: '#999'
}
},
axisLabel: {
color: '#666'
}
}
\],
series: \[
{
name: '热度',
type: 'bar',
label: {
normal: {
show: true,
position: 'inside'
}
},
data: \[300, 270, 340, 344, 300, 320, 310\],
itemStyle: {
// emphasis: {
// color: '#37a2da'
// }
}
},
{
name: '正面',
type: 'bar',
stack: '总量',
label: {
normal: {
show: true
}
},
data: \[120, 102, 141, 174, 190, 250, 220\],
itemStyle: {
// emphasis: {
// color: '#32c5e9'
// }
}
},
{
name: '负面',
type: 'bar',
stack: '总量',
label: {
normal: {
show: true,
position: 'left'
}
},
data: \[-20, -32, -21, -34, -90, -130, -110\],
itemStyle: {
// emphasis: {
// color: '#67e0e3'
// }
}
}
\]
};
chart.setOption(option);
return chart;
}
Page({
data: {
echarts,
ec: {
onInit: initChart
}
},
onReady() {
setTimeout(function () {
// 获取 chart 实例的方式
console.log(chart)
}, 2000);
}
})
## Taro 引用
参考代码 `examples/taro`
### 准备工作
1. 安装依赖
npm install echarts-for-weixin
2. 在项目根目录中新建文件 `project.package.json` 或者自定义命名,此文件是小程序的 `package.json`,并在下一步中添加小程序自定义构建 npm 方式。这么做的目的是为了能够共享项目 `node_modules`
`project.package.json`
{
"dependencies": {
"echarts": "^5.1.2",
"echarts-for-weixin": "^1.0.2"
}
}
3. 在 `project.config` 的 `setting` 中添加小程序自定义构建 npm 方式,参考 自定义 node\_modules 和 miniprogram\_npm 位置的构建 npm 方式
{
"setting": {
"packNpmManually": true,
"packNpmRelationList": \[
{
"packageJsonPath": "../project.package.json",
"miniprogramNpmDistDir": "./"
}
\]
}
}
4. 执行 `Taro` 的开发或者打包命令进行项目开发
npm run dev:weapp
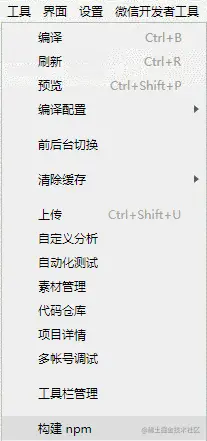
5. 小程序开发者工具中构建 npm。注意:小程序开发工具打开的项目目录是 `dist` 文件夹
点击开发者工具中的菜单栏:工具 --> 构建 npm
### 引入 Echarts
1. 在全局的 `app.config.js` 中添加或者在单个需要使用到 `echarts` 的页面配置中添加引用组件
{
"usingComponents": {
"ec-canvas": "echarts-for-weixin"
}
}
2. 在页面中引入 `echarts`,可以从 `npm` 引入 `echarts`,也可以引入本地自定义构建的 `echarts` 以减小体积
import \* as echarts from 'echarts' // 从 npm 引入 echarts
import \* as echarts from './echarts' // 或者从本地引入自定义构建的 echarts
3. 将引入的 `echarts` 传给组件
4. `ec-canvas` 的具体用法和如何初始化图表请参考 Echarts 官方小程序示例
示例代码
function initChart(canvas, width, height) { const chart = echarts.init(canvas, null, { width: width, height: height
})
canvas.setChart(chart) const model = { yCates: \['Saturday', 'Friday', 'Thursday', 'Wednesday', 'Tuesday', 'Monday', 'Sunday'\], xCates: \['1', '2', '3', '4', '5'\], data: \[ // \[yCateIndex, xCateIndex, value\]
\[0, 0, 5\], \[0, 1, 7\], \[0, 2, 3\], \[0, 3, 5\], \[0, 4, 2\],
\[1, 0, 1\], \[1, 1, 2\], \[1, 2, 4\], \[1, 3, 8\], \[1, 4, 2\],
\[2, 0, 2\], \[2, 1, 3\], \[2, 2, 8\], \[2, 3, 6\], \[2, 4, 7\],
\[3, 0, 3\], \[3, 1, 7\], \[3, 2, 5\], \[3, 3, 1\], \[3, 4, 6\],
\[4, 0, 3\], \[4, 1, 2\], \[4, 2, 7\], \[4, 3, 8\], \[4, 4, 9\],
\[5, 0, 2\], \[5, 1, 2\], \[5, 2, 3\], \[5, 3, 4\], \[5, 4, 7\],
\[6, 0, 6\], \[6, 1, 5\], \[6, 2, 3\], \[6, 3, 1\], \[6, 4, 2\]
\]
} const data = model.data.map(function (item) { return \[item\[1\], item\[0\], item\[2\] || '-'\]
}) const option = { tooltip: { position: 'top'
}, animation: false, grid: { bottom: 60, top: 10, left: 80
}, xAxis: { type: 'category', data: model.xCates
}, yAxis: { type: 'category', data: model.yCates
}, visualMap: { min: 1, max: 10, show: false, calculable: true, orient: 'horizontal', left: 'center', bottom: 10, inRange: { color: \['#37A2DA', '#32C5E9', '#67E0E3', '#91F2DE', '#FFDB5C', '#FF9F7F'\],
}
}, series: \[{ name: 'Punch Card', type: 'heatmap', data: data, label: { normal: { show: true
}
}, itemStyle: { emphasis: { shadowBlur: 10, shadowColor: 'rgba(0, 0, 0, 0.5)'
}
}
}\]
}
chart.setOption(option) return chart
}export default class Echarts extends React.Component {
state = { ec: { onInit: initChart
}
}
render () { return (
)
}
}复制代码
## Taro 按需引用
参考代码 `examples/taro-manual-load`
注意:小程序开发者工具打开的项目目录是打包后的 `dist` 目录
### 准备工作
1、安装依赖
npm install echarts-for-weixin
2、在项目根目录中新建文件 `project.package.json` 或者自定义命名,此文件是小程序的 `package.json`,并在下一步中添加小程序自定义构建 npm 方式。并配置 `config/index.js` 中的 `copy` 选项,将 `project.package.json` 复制到 `dist` 目录下并且重命名为 `package.json`。并且复制 `node_modules/echarts-for-weixin` 至 `dist/node_modules/echarts-for-weixin` 避免在小程序开发者工具中打开的项目重新安装依赖
`project.package.json`
{
"dependencies": {
"echarts-for-weixin": "^1.0.2"
}
}
`config/index.js`
{
copy: {
patterns: \[
{ from: 'project.package.json', to: 'dist/package.json' }, // 指定需要 copy 的文件
{ from: 'node\_modules/echarts-for-weixin/', to: 'dist/node\_modules/echarts-for-weixin/' }
\],
options: {}
}
}
3、在 `project.config` 的 `setting` 中添加小程序自定义构建 npm 方式,参考 自定义 node\_modules 和 miniprogram\_npm 位置的构建 npm 方式
{
"setting": {
"packNpmManually": true,
"packNpmRelationList": \[
{
"packageJsonPath": "./package.json",
"miniprogramNpmDistDir": "./"
}
\]
}
}
4、执行 `Taro` 的开发或者打包命令进行项目开发
npm run dev:weapp
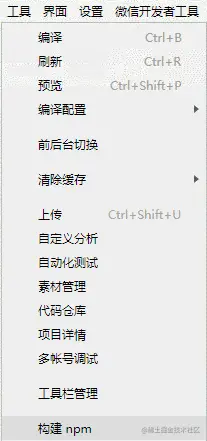
5、小程序开发者工具中构建 npm。注意:小程序开发工具打开的项目目录是 `dist` 文件夹
点击开发者工具中的菜单栏:工具 --> 构建 npm
### **引入 Echarts**
1、在全局的 `app.config.js` 中添加或者在单个需要使用到 `echarts` 的页面配置中添加引用组件
{
"usingComponents": {
"ec-canvas": "echarts-for-weixin"
}
}
2、在页面中引入 `echarts/core` 和需要的组件,Taro 打包会只打包引入的组件,这样达到按需引入的目的
// Import the echarts core module, which provides the necessary interfaces for using echarts.
import \* as echarts from 'echarts/core';
// Import charts, all with Chart suffix
import {
// LineChart,
BarChart,
// PieChart,
// ScatterChart,
// RadarChart,
// MapChart,
// TreeChart,
// TreemapChart,
// GraphChart,
// GaugeChart,
// FunnelChart,
// ParallelChart,
// SankeyChart,
// BoxplotChart,
// CandlestickChart,
// EffectScatterChart,
// LinesChart,
// HeatmapChart,
// PictorialBarChart,
// ThemeRiverChart,
// SunburstChart,
// CustomChart,
} from 'echarts/charts';
// import components, all suffixed with Component
import {
// GridSimpleComponent,
GridComponent,
// PolarComponent,
// RadarComponent,
// GeoComponent,
// SingleAxisComponent,
// ParallelComponent,
// CalendarComponent,
// GraphicComponent,
// ToolboxComponent,
TooltipComponent,
// AxisPointerComponent,
// BrushComponent,
TitleComponent,
// TimelineComponent,
// MarkPointComponent,
// MarkLineComponent,
// MarkAreaComponent,
// LegendComponent,
// LegendScrollComponent,
// LegendPlainComponent,
// DataZoomComponent,
// DataZoomInsideComponent,
// DataZoomSliderComponent,
// VisualMapComponent,
// VisualMapContinuousComponent,
// VisualMapPiecewiseComponent,
// AriaComponent,
// TransformComponent,
DatasetComponent,
} from 'echarts/components';
// Import renderer, note that introducing the CanvasRenderer or SVGRenderer is a required step
import {
CanvasRenderer,
// SVGRenderer,
} from 'echarts/renderers';
// Register the required components
echarts.use(
\[
TitleComponent,
TooltipComponent,
GridComponent,
BarChart,
CanvasRenderer,
HeatmapChart,
VisualMapComponent,
VisualMapContinuousComponent,
VisualMapPiecewiseComponent,
\]
);
3、将引入的 `echarts` 传给组件
4、`ec-canvas` 的具体用法和如何初始化图表请参考 Echarts 官方小程序示例
function initChart(canvas, width, height) {
const chart = echarts.init(canvas, null, {
width: width,
height: height
})
canvas.setChart(chart)
const model = {
yCates: \['Saturday', 'Friday', 'Thursday',
'Wednesday', 'Tuesday', 'Monday',
'Sunday'\],
xCates: \['1', '2', '3', '4', '5'\],
data: \[
// \[yCateIndex, xCateIndex, value\]
\[0, 0, 5\], \[0, 1, 7\], \[0, 2, 3\], \[0, 3, 5\], \[0, 4, 2\],
\[1, 0, 1\], \[1, 1, 2\], \[1, 2, 4\], \[1, 3, 8\], \[1, 4, 2\],
\[2, 0, 2\], \[2, 1, 3\], \[2, 2, 8\], \[2, 3, 6\], \[2, 4, 7\],
\[3, 0, 3\], \[3, 1, 7\], \[3, 2, 5\], \[3, 3, 1\], \[3, 4, 6\],
\[4, 0, 3\], \[4, 1, 2\], \[4, 2, 7\], \[4, 3, 8\], \[4, 4, 9\],
\[5, 0, 2\], \[5, 1, 2\], \[5, 2, 3\], \[5, 3, 4\], \[5, 4, 7\],
\[6, 0, 6\], \[6, 1, 5\], \[6, 2, 3\], \[6, 3, 1\], \[6, 4, 2\]
\]
}
const data = model.data.map(function (item) {
return \[item\[1\], item\[0\], item\[2\] || '-'\]
})
const option = {
tooltip: {
position: 'top'
},
animation: false,
grid: {
bottom: 60,
top: 10,
left: 80
},
xAxis: {
type: 'category',
data: model.xCates
},
yAxis: {
type: 'category',
data: model.yCates
},
visualMap: {
min: 1,
max: 10,
show: false,
calculable: true,
orient: 'horizontal',
left: 'center',
bottom: 10,
inRange: {
color: \['#37A2DA', '#32C5E9', '#67E0E3', '#91F2DE', '#FFDB5C', '#FF9F7F'\],
}
},
series: \[{
name: 'Punch Card',
type: 'heatmap',
data: data,
label: {
normal: {
show: true
}
},
itemStyle: {
emphasis: {
shadowBlur: 10,
shadowColor: 'rgba(0, 0, 0, 0.5)'
}
}
}\]
}
chart.setOption(option)
return chart
}
export default class Echarts extends React.Component {
state = {
ec: {
onInit: initChart
}
}
render () {
return (
)
}
}
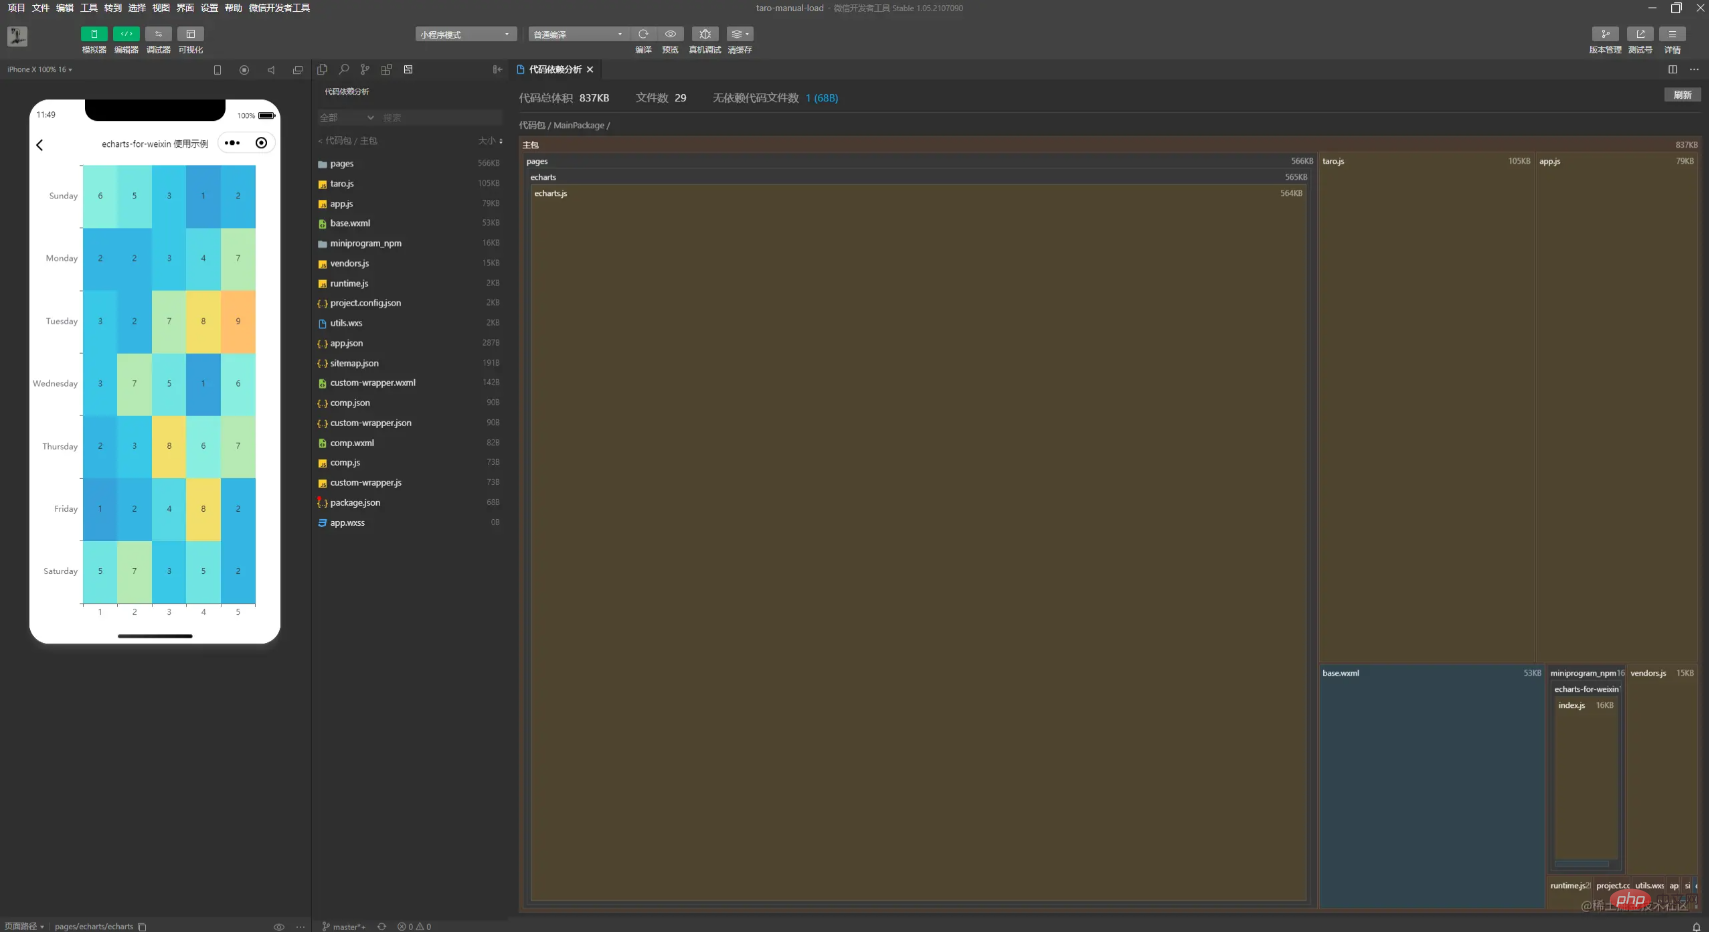
5、可以查看小程序开发者工具中的依赖分析,确定文件大小以及是否正确按需引入
更多编程相关知识,请访问:编程入门!!
以上就是详解微信小程序中如何安装和引用ECharts?的详细内容,更多请关注知企PROSAAS其它相关文章!
**Tags:** apache, canvas, copy, echarts, for, JS, json, npm, taro, 微信小程序
**Categories:** 后端开发
---